 Paikkatietohakemisto
geoscientificInformation
Type of resources
Available actions
Topics
Keywords
Contact for the resource
Provided by
Years
Formats
Representation types
Update frequencies
status
Scale
-
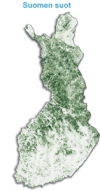
The data set relating to overall mapping of national peat resources contains by focus area those mires over 20 ha in extent that are most important from a peat production perspective. Since 1975 additional smaller areas have been included as required. For each mire, there are data on mire type, peat type, peat reserves, peat physical properties, mires that are suitable for peat production, peat quality and exploitable peat reserves. This information is published in municipality-specific peat investigation reports that present general information on each mire investigated and their applicability to energy, horticultural and environmental peat production as well as to protection purposes, among other uses.
-
Sedimentation rates are part of EMODnet (European Marine Observation and Data network) Geology, Work Package 3 (WP3) Seabed substrate. The objective of WP3 is to compile all available seabed substrate information on a scale of 1:100 000 or finer from all European marine areas, and to update sedimentation rate data collected in the previous phases. WP3 has compiled and harmonized available information on the rate of sedimentation on the seafloor. The information on sedimentation rates for recent sediments is presented as point-source information. Estimations of modern sedimentation rates (centimetres/year) can be based e.g. on established historical records of anthropogenic radionuclides (e.g. 137Cs and 241Am), polychlorinated biphenyls (PCBs), lead (Pb) and stable lead isotope (206/207Pb ratios). Sedimentation rate estimations can be based also on varve/laminae counting, radionuclide 210Pb and 14C decay dating methods. In addition stratigraphic marker horizons, like in the Baltic Sea, horizons formed by documented Major Baltic Inflow (MBIs) events (Moros et al. 2017), can be used in the estimations. Project partners have delivered information on sedimentation rates available in their national waters including their EEZ. The focus is on the present-day sedimentation rates. That means sediment accumulation to the seabed over the past decades, since AD 1900 or so. Further information about the EMODnet-Geology project is available on the portal (http://www.emodnet-geology.eu/).
-
The EMODnet (European Marine Observation and Data network) Geology project collects and harmonizes marine geological data from the European sea areas to support decision making and sustainable marine spatial planning. The partnership includes 39 marine organizations from 30 countries. The partners, mainly from the marine departments of the geological surveys of Europe (through the Association of European Geological Surveys-EuroGeoSurveys), have assembled marine geological information at various scales from all European sea areas (e.g. the White Sea, Baltic Sea, Barents Sea, the Iberian Coast, and the Mediterranean Sea within EU waters). This dataset includes EMODnet seabed substrate maps at a scale of 1:45 000 from the European marine areas. Traditionally, European countries have conducted their marine geological surveys according to their own national standards and classified substrates on the grounds of their national classification schemes. These national classifications are harmonised into a shared EMODnet schema using Folk's sediment triangle with a hierarchy of 16, 7 and 5 substrate classes. The data describes the seabed substrate from the uppermost 30 cm of the sediment column. Further information about the EMODnet Geology project is available on the portal (http://www.emodnet-geology.eu/).
-
The database consists of three components: "Published age determination”, ”Published Sm-Nd isotope data" and "Pb isotope data on galena". The "Published age determination" database is based on age determinations, which comprise predominantly U-Pb zircon data produced at the Geological Survey of Finland since 1960’s. For igneous rocks the age register contains radiometric ages mostly interpreted as primary ages. The information given consists of location data, rock type, method, mineral analyzed, age results, comments and references. "Published Sm-Nd isotope data" comprise Sm-Nd data procuded at GTK since 1981, which mostly are used to constrain the origin of crust. "Pb isotope data on galena" gives results produced at GTK since 1970's, and include also previously unpublished data.
-
The EMODnet (European Marine Observation and Data network) Geology project collects and harmonizes marine geological data from the European sea areas to support decision making and sustainable marine spatial planning. The partnership includes 39 marine organizations from 30 countries. The partners, mainly from the marine departments of the geological surveys of Europe (through the Association of European Geological Surveys-EuroGeoSurveys), have assembled marine geological information at various scales from all European sea areas (e.g. the White Sea, Baltic Sea, Barents Sea, the Iberian Coast, and the Mediterranean Sea within EU waters). This dataset includes EMODnet seabed substrate maps at a scale of 1:50 000 from the European marine areas. Traditionally, European countries have conducted their marine geological surveys according to their own national standards and classified substrates on the grounds of their national classification schemes. These national classifications are harmonised into a shared EMODnet schema using Folk's sediment triangle with a hierarchy of 16, 7 and 5 substrate classes. The data describes the seabed substrate from the uppermost 30 cm of the sediment column. Further information about the EMODnet Geology project is available on the portal (http://www.emodnet-geology.eu/).
-
The GTK’s Mineral Deposit database contains all mineral deposits, occurrences and prospects in Finland. Structure of the new database was created in 2012 and it is based on global geostan-dards (GeoSciML and EarthResourceML) and classifications related to them. The database is in Oracle, data products are extracted from the primary database. During 2013 GTK’s separate mineral deposit databases (Au, Zn, Ni, PGE, U, Cu, Industrial minerals, FODD, old ore deposit database) were combined into a single entity. New database contains extensive amount of information about mineral occurrence feature along with its associated commodities, exploration activities, holding history, mineral resource and re-serve estimates, mining activity, production and geology (genetic type, host and wall rocks, min-erals, metamorphism, alteration, age, texture, structure etc.) Database will be updated whenever new data (e.g. resource estimate) is available or new deposit is found. Entries contain references to all published literature and other primary sources of data. Also figures (maps, cross sections, photographs etc.) can be linked to mineral deposit data. Data is based on all public information on the deposits available including published literature, archive reports, press releases, companies’ web pages, and interviews of exploration geologists. Database contains 33 linked tables with 216 data fields. Detailed description of the tables and fields can be found in separate document. (http://tupa/metaviite/MDD_FieldDescription.pdf) The data products extracted from the database are available on Mineral Deposits and Exploration map service (http://gtkdata.gtk.fi/MDaE/index.html) and from Hakku -service (http://hakku.gtk.fi).
-
The EMODnet (European Marine Observation and Data network) Geology project collects and harmonizes marine geological data from the European sea areas to support decision making and sustainable marine spatial planning. The partnership includes 39 marine organizations from 30 countries. The partners, mainly from the marine departments of the geological surveys of Europe (through the Association of European Geological Surveys-EuroGeoSurveys), have assembled marine geological information at various scales from all European sea areas (e.g. the White Sea, Baltic Sea, Barents Sea, the Iberian Coast, and the Mediterranean Sea within EU waters). This dataset includes EMODnet seabed substrate maps at a scale of 1:1 500 from the European marine areas. Traditionally, European countries have conducted their marine geological surveys according to their own national standards and classified substrates on the grounds of their national classification schemes. These national classifications are harmonised into a shared EMODnet schema using Folk's sediment triangle with a hierarchy of 16, 7 and 5 substrate classes. The data describes the seabed substrate from the uppermost 30 cm of the sediment column. Further information about the EMODnet Geology project is available on the portal (http://www.emodnet-geology.eu/).
-
The EMODnet (European Marine Observation and Data network) Geology project collects and harmonizes marine geological data from the European sea areas to support decision making and sustainable marine spatial planning. The partnership includes 39 marine organizations from 30 countries. The partners, mainly from the marine departments of the geological surveys of Europe (through the Association of European Geological Surveys-EuroGeoSurveys), have assembled marine geological information at various scales from all European sea areas (e.g. the White Sea, Baltic Sea, Barents Sea, the Iberian Coast, and the Mediterranean Sea within EU waters). This dataset includes EMODnet seabed substrate maps at a scale of 1:15 000 from the European marine areas. Traditionally, European countries have conducted their marine geological surveys according to their own national standards and classified substrates on the grounds of their national classification schemes. These national classifications are harmonised into a shared EMODnet schema using Folk's sediment triangle with a hierarchy of 16, 7 and 5 substrate classes. The data describes the seabed substrate from the uppermost 30 cm of the sediment column. Further information about the EMODnet Geology project is available on the portal (http://www.emodnet-geology.eu/).
-
The Superficial deposits of Finland 1:200 000 (sediment polygons) contains data produced from the whole of Finland during the period 2002-2009. The data set can be used in regional planning, in military defence, in soil mapping (EU) and in joint mapping projects in various areas. The mapping scale has been 1:50 000-1:200 000. In compiling the medium-scale data set, generalised 1:20 000, 1:50 000 and 1:100 000 superficial deposits maps have been used and a new map product at a scale of 1:200 000 that is based on interpretation and field mapping. The minimum size of the sediment polygons is about six hectares. Exceptions are glaciofluvial, marginal till and hummocky moraine deposits, which are presented in the data set as areas with a surface area greater than two hectares. The blanketing peat overburden has been described in the new map product as a peat-covered area (0-0.3 m of peat), thin peat (0.3-0.6 m of peat) and thick peat (over 0.6 m of peat). Peat-covered areas, stone fields and uncovered bedrock areas have been added to the new production map by generalising the corresponding polygons in the terrain database of the National Land Survey of Finland (NLS). In connection with the generation of new production map, field observations have been gathered on the overburden thickness and the stratigraphic sequence at a depth of one metre as well as on rock exposures. Coordinate reference system of the Superficial deposits of Finland 1:200 000 (sediment polygons) was transformed in March 2013. The transformation from Finnish National Grid Coordinate System (Kartastokoordinaattijärjestelmä, KKJ) Uniform Coordinate Frame to ETRS-TM35FIN projection was done by using the three-dimensional transformation in accordance with the recommendations for the public administration JHS154.
-
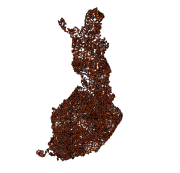
The Regional Till Geochemical Mapping data set gives information on the concentrations of 37 elements in unaltered basal till. The samples have been taken, in 1983, from an unaltered basal till (C horizon) below the groundwater table at a depth of ca. 70 cm (variation 50-200 cm) with a density of one sample per 300 km2. The data set covers the whole of Finland with a total sample amount of 1056. The samples are composite field samples. The calculated sample point coordinates entered in the data set have been obtained from the centroid coordinates of five subsamples. The subsamples have been collected from a 300 m x 1000 m rectangular-shaped area. In Northern Finland, samples have been obtained by including samples taken previously in the Nordkallot Project. The samples have been sieved for analysis at a grain size grade less than 0.06 mm. The samples have been analysed for total elemental concentrations and aqua regia concentrations. Total concentrations have been determined either by neutron activation analysis (method code 900N) or by total dissolution with strong concentrated mineral acids (method code 312P). The analysis code for aqua regia dissolution is 511P. Gold and palladium have been determined with a analysis method based on flameless atomic absorption (519U). The sulfur concentration has been determined with a LECO analyser (810L). Further, total concentrations (312P) and aqua regia soluble concentrations (511P) were determined from Southern Finland and Mid-Finland samples with a grain size grade less than two millimetres. The original purpose of the Regional Till Geochemical Mapping data set was national geochemical general mapping and ore exploration. Other uses are, for example, estimating the baseline concentration of the soil, the nutrient levels of forest soil, assessing the buffering capacity of base cations in the soil and evaluating the weathering rate.