 Paikkatietohakemisto
Type of resources
Available actions
Topics
Keywords
Contact for the resource
Provided by
Years
Formats
Representation types
Update frequencies
status
Service types
Scale
Resolution
-
FIN Aineiston tarkoituksena on: -Identifioida tie- ja rata-alueet, joiden varrella esiintyy uhanalaisia ja silmälläpidettäviä lajeja -Identifioida tie- ja rata-alueet, joiden varrella esiintyy hyviä elinvoimaisia niittyindikaattorilajeja (hyönteisten mesi- ja ravintokasveja) -Identifioida tie- ja rata-alueet, joiden varrella esiintyy suojelualueita -Identifioida tie- ja rata-alueet, joiden varrella esiintyy komealupiinia tai kurtturuusua -Identifioida tie- ja rata-alueet, joiden varrella esiintyy komealupiinia tai kurtturuusua uhanalaisten lajien lisäksi -> Löytää herkät alueet ja paikallistaa vieraslajien uhka Tieto esitetään 1 kilometrin ruuduissa. Aineistosta on julkaistu kaksi erillistä versiota. -VaylanvarsienVieraslajitJaArvokkaatElinymparistot_avoin: Avoin versio, jonka lajitietoa on karkeistettu mahdollisista herkistä lajeista johtuen. Aineisto kuuluu SYKEn avoimiin aineistoihin (CC BY 4.0) ja sitä saa käyttää lisenssiehtojen mukaisesti -VaylanvarsienVieraslajitJaArvokkaatElinymparistot_kayttorajoitettu: Alkuperäinen karkeistamaton versio. Tämä versio on vain viranomaiskäyttöön eikä kyseistä aineistoa saa jakaa Aineistosta on tehty tarkempi menetelmäkuvaus https://geoportal.ymparisto.fi/meta/julkinen/dokumentit/VierasVayla_Menetelmakuvaus.pdf sekä muuttujaseloste https://geoportal.ymparisto.fi/meta/julkinen/dokumentit/VierasVayla_VariableDescription.xlsx ENG The purpose of the material is to: -Identify road and rail areas that have nearby observations of endangered and near threatened species -Identify road and rail areas with good meadow indicator plant species -Identify road and rail areas along which there are protected areas -Identify the road and rail areas along which there are observations of Lupinus polyphyllus or Rosa rugosa observations -Identify the road and rail areas along which there are Lupinus polyphyllus or Rosa rugosa observations in addition to sensitive species -> Finds sensitive areas and identify the overall threat of alien species The data is presented in 1-kilometer square grid cells. There are two separate versions of the data. -VaylanvarsienVieraslajitJaArvokkaatElinymparistot_avoin: Open access version, in which its species-related parts have been simplified due to data restriction issues. The material belongs to Syke's open materials (CC BY 4.0) and may be used in accordance with the license terms. -VaylanvarsienVieraslajitJaArvokkaatElinymparistot_kayttorajoitettu: Original version. This version is only for official use and the material in question may not be shared. A more precise description about the data procedures can be found from (In Finnish) https://geoportal.ymparisto.fi/meta/julkinen/dokumentit/VierasVayla_Menetelmakuvaus.pdf Furthermore, all the variables in the data are explained in this bilingual variable description https://geoportal.ymparisto.fi/meta/julkinen/dokumentit/VierasVayla_VariableDescription.xlsx This dataset was updated with the newest species observations on 10/2023 and 11/2024 Process code for this can be found from https://github.com/PossibleSolutions/VierasVayla_SpeciesUpdate
-
The Arctic SDI Gazetteer Service is a service that contains authoritative place names data from the arctic area. The service can be used for searching place names and performing reverse geocoding. The service contains about 2.87 million place name locations with about 3.15 million place names. It contains data from following sources: * Canada (Natural Resources Canada, updated: 02/2018) * Denmark (including Greenland) (SDFE, updated: 05/2017) * Finland (National Land Survey of Finland, updated: 04/2017) * GEBCO Undersea feature names gazetteer (updated: 04/2019) * Iceland (National Land Survey of Iceland, updated: 08/2017) * Norway (Norwegian Mapping Authority, updated: 08/2017) * Russia (Russian Mapping Agency, updated: 04/2019) * Sweden (Swedish National Mapping Agency, updated: 05/2017) * USA (US Geological Survey, updated: 05/2017)
-
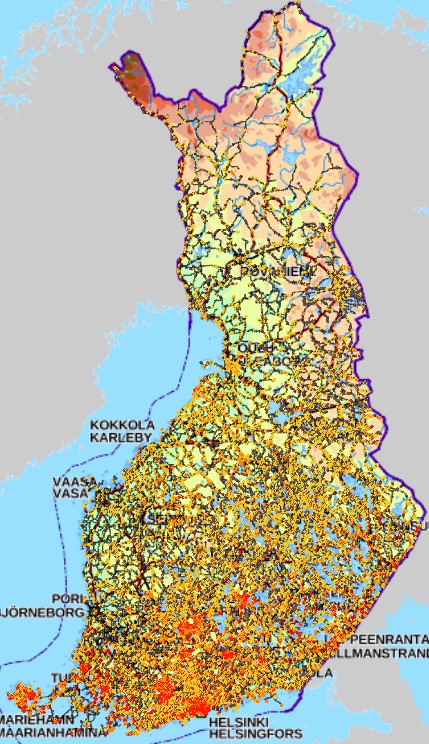
The Finnish Forest Research Institute (Metla) developed a method called multi-source national forest inventory (MS-NFI). The first operative results were calculated in 1990. Small area forest resource estimates, in here municipality level estimates, and estimates of variables in map form are calculated using field data from the Finnish national forest inventory, satellite images and other digital georeferenced data, such as topographic database of the National Land Survey of Finland. Twelve sets of estimates have been produced for the most part of the country until now and eleven sets for Lapland. The number of the map form themes in the most recent version, from year 2023, is 45. In addition to the volumes by tree species and timber assortments, the biomass by tree species groups and tree compartments have been estimated. The first country level estimates correspond to years 1990-1994. The most recent versions are from years 2005, 2007, 2009, 2011, 2013, 2015, 2017, 2019, 2021 and 2023. The maps from 2023 is the eighth set of products freely available. It is also the fifth set produced by the Natural Resources Institute Finland. A new set of the products will be produced annually or biannually in the future. The maps are in a raster format with a pixel size of 16m x 16m (from 2013) and in the ETRS-TM35FIN coordinate system. The products cover the combined land categories forest land, poorly productive forest land and unproductive land. The other land categories as well as water bodies have been delineated out using the elements of the topographic database of the Land Survey of Finland.
-
Seabed substrate 1:100 000 is one of the products produced in the EMODnet (European Marine Observation and Data network) Geology III EU project. Project provided seabed geological material from the European maritime areas. The EMODnet Geology III project (http://www.emodnet-geology.eu/) collects and harmonizes geological data from the European sea areas to support decision-making and sustainable marine spatial planning. The EMODnet Geology partnership has included 39 marine organizations from 30 countries. This data includes the EMODnet seabed substrate map at a scale of 1:100 000 from the Finnish marine areas. It is based on the data produced on a scale of 1:20 000 by the Geological Survey of Finland (GTK). The data has been harmonized and reclassified into five Folk substrate classes (clay + silt (mud), sandy clays, clayey sands, coarse sediments, mixed sediments) and bedrock. The data describes the seabed substrate from the uppermost 30 cm of the sediment column. The data have been generalized into a target scale (1:100 000). The smallest smallest cartographic unit within the data is 0.05 km2 (5 hectares). Further information about the EMODnet-Geology project III is available on the portal (http://www.emodnet-geology.eu/). Permission (AN17367) to publish the material was obtained from the Finnish Defence Office 29.9.2017.
-
-
This dataset contains borders of the HELCOM MPAs (former Baltic Sea Protected Areas (BSPAs). The dataset has been compiled from data submitted by HELCOM Contracting Parties. It includes the borders of designated HELCOM MPAs stored in the http://mpas.helcom.fi. The designation is based on the HELCOM Recommendation 15/5 (1994). The dataset displays all designated or managed MPAs as officially reported to HELCOM by the respective Contracting Party. The latest related HELCOM publication based on MPA related data is http://www.helcom.fi/Lists/Publications/BSEP148.pdf The dataset contains the following information: MPA_ID: Unique ID of the MPA as used in HELCOM Marine Protected Areas database Name: Name of the MPA Country: Country where MPA is located Site_link: Direct link to site's fact sheet in the http://mpas.helcom.fi where additional information is available MPA_status: Management status of the MPA Date_est: Establishment date of the MPA Year_est: Establishment year of the MPA
-

Paikkatietohakemisto is a tool for describing geographical data and services. Paikkatietohakemisto is a national metadata discovery service, providing published metadata through a CSW interface.
-
-
KUVAUS: Karttataso kuvastaa Tampereen kaupungin katualueiden maksuluokkia sekä niihin liittyviä tarkastus- ja valvontamaksuja. KATTAVUUS: Julkisesti kaikille käyttäjille Oskari-karttapalvelussa. PÄIVITYS: Satunnainen (vain tarvittaessa). Karttatason tietojen päivittämisestä vastaa Tampereen kaupungin Katutilavalvonnan yksikkö. YLLÄPITOSOVELLUS: Tampereen kaupungin tiedostopalvelin ja PostGIS-tietokanta KOORDINAATTIJÄRJESTELMÄ: Aineisto tallennetaan ETRS-GK24FIN (EPSG:3878) tasokoordinaattijärjestelmässä GEOMETRIA: vektori (viiva) SAATAVUUS: Aineisto on tallennettu Postgis-tietokantaan. JULKISUUS: Aineisto on nähtävillä julkisesti kaikille käyttäjille Oskari-karttapalvelussa. TIETOSUOJA: Aineistoon ei liity tietosuojakysymyksiä. AINEISTOSTA VASTAAVA TAHO: Tampereen kaupunki, Katutilavalvonta, katuluvat@tampere.fi
-
The EMODnet (European Marine Observation and Data network) Geology project (http://www.emodnet-geology.eu/) collects and harmonizes marine geological data from the European sea areas to support decision- making and sustainable marine spatial planning. The partnership includes 36 marine organizations from 30 countries. The partners, mainly from the marine departments of the geological surveys of Europe (through the Association of European Geological Surveys-EuroGeoSurveys), have assembled marine geological information at a scale of 1:250 000 from all European sea areas (e.g. the White Sea, Baltic Sea, Barents Sea, the Iberian Coast, and the Mediterranean Sea within EU waters). This data includes the EMODnet seabed substrate map at a scale of 1:250 000 from the European marine areas. Traditionally, European countries have conducted their marine geological surveys according to their own national standards and classified substrates on the grounds of their national classification schemes. These national classifications are harmonized into a shared EMODnet schema using Folk's sediment triangle with a hierarchy of 16, 7 and 5 substrate classes. The data describes the seabed substrate from the uppermost 30 cm of the sediment column. The data has been generalized into a target scale (1:250 000). The smallest cartographic unit within the data is 0.3 km2 (30 hectares). Further information about the EMODnet-Geology project is available on the portal (http://www.emodnet-geology.eu/).