1000
Type of resources
Available actions
Topics
Keywords
Contact for the resource
Provided by
Years
Formats
Representation types
Update frequencies
status
Scale
Resolution
-
Number of population by 5 km x 5 km grids. The number of population on the last day of the reference year (31 December) by age group. Data includes only inhabited grids. The statistical variables of the data are: Total population (vaesto), number of men (miehet) and women (naiset), under 15 year olds (ika_0_14), 15–64 year olds (ika_15_64), and aged over 65 (ika_65_). Only the number of population is reported for grids of under 10 inhabitants. A grid identifier is expressed using a national identification code derived from the coordinates (idD_nro (num)) and INSPIRE's standard identification code (grd_id (char)). The data also contains the coordinates of the lower left-hand corner of a grid (xkoord, ykoord (num)). The data describes the population distribution independent of administrative areas (such as municipal borders). The data is suitable for examination of population distribution and making various spatial analysis. The general Terms of Use must be observed when using the data: https://tilastokeskus.fi/org/lainsaadanto/copyright_en.html. In addition to the national version, an INSPIRE information product is also available from the data.
-

Grid net for statistics 1 km x 1 km covers whole of Finland. The grid net includes all grid cells in Finland. The location reference of a grid cell is the coordinates of the bottom left corner of each grid cell. An identifier in accordance with national conventions (consecutive numbering) has also been produced for each grid cell. The Grid net for statistics 1 km x 1 km is the area division used in the production of statistics by 1 km x 1 km grid cells. For utilizing grid data auxiliary table of regional classifications are available: https://www.stat.fi/org/avoindata/paikkatietoaineistot/tilastoruudukko_1km_en.html. The general Terms of Use must be observed when using the data: https://tilastokeskus.fi/org/lainsaadanto/copyright_en.html. In addition to the national version, an INSPIRE information product is also available from the data.
-
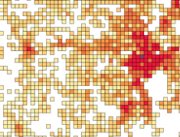
Number of population by 1 km x 1 km grids. The number of population on the last day of the reference year (31 December) by age group. Data includes only inhabited grids. The statistical variables of the data are: Total population (vaesto), number of men (miehet) and women (naiset), under 15 year olds (ika_0_14), 15-64 year olds (ika_15_64), and aged over 65 (ika_65_). Only the number of population is reported for grids of under 10 inhabitants. A grid identifier is expressed using a national identification code derived from the coordinates (idD_nro (num)) and INSPIRE's standard identification code (grd_id (char)). The data also contains the coordinates of the lower left-hand corner of a grid (xkoord, ykoord (num)). The data describes the population distribution independent of administrative areas (such as municipal borders). The data is suitable for examination of population distribution and making various spatial analysis. Data is available as polygons and as centroids of grid cells. The general Terms of Use must be observed when using the data: https://tilastokeskus.fi/org/lainsaadanto/copyright_en.html. In addition to the national version, an INSPIRE information product is also available from the data.
-
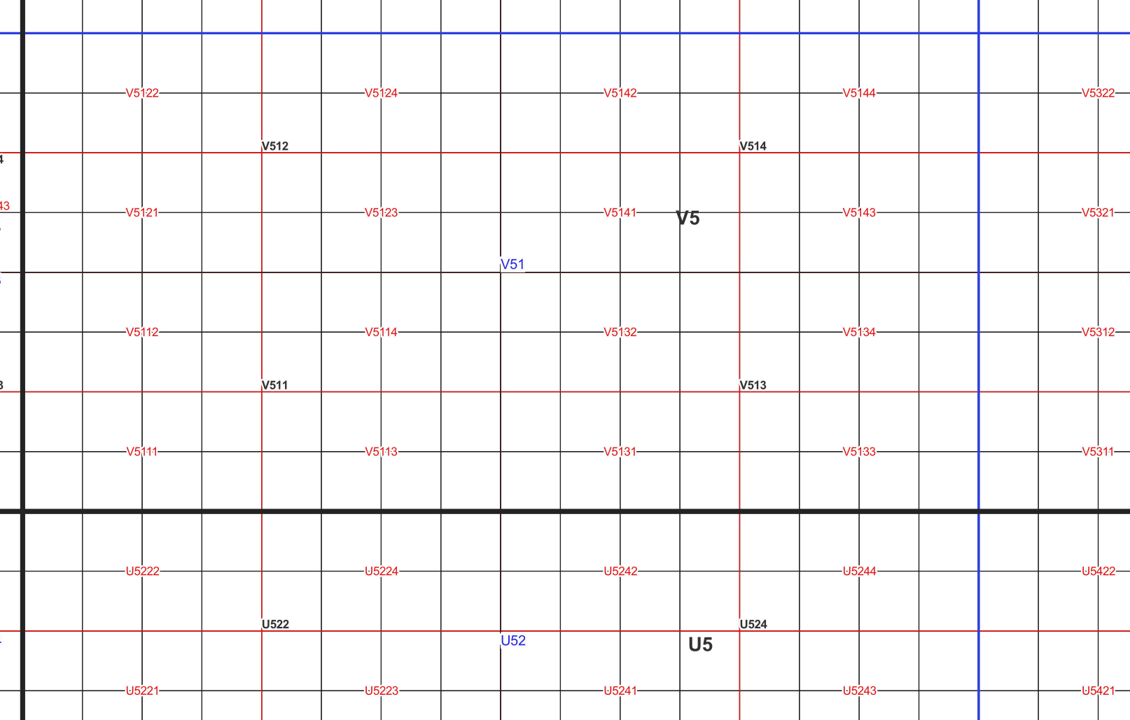
The map sheet division is a system created for printing maps, which covers map sheet codes, map scales and map sheet sizes. The map sheet division is a system created for printing maps, which covers map sheet codes, map scales and map sheet sizes. Today, map sheet division is also used for other purposes. It is also possible to download other NLS datasets in addition to maps in accordance with map sheet division. The map sheet division TM35, which is based on the projected coordinate reference system ETRS-TM35FIN is in use today. Before 2007, a map sheet division that was based on the KKS coordinate reference system was used. The TM35 map sheet division consists of 7 different grid sizes, the smallest scale is 1:200,000 and the largest is 1:5000. An explanation of how the grids are further split into more detailed grids and the principles of map sheet numbering is on the National Land Survey website (in Finnish) https://www.maanmittauslaitos.fi/kartat-ja-paikkatieto/kartat/osta-kartta/nain-loydat-oikean-karttalehden. The attribute data of the grids include map sheet number, the area of a square on the grid, perimeter and the coordinates of the centre of the square. The map sheet division is available as a file in vector format and through our contract-based WMTS service in raster format. In addition, you can view it in the geoportal Paikkatietoikkuna. The product is a part of the open data of the National Land Survey.
-

Road traffic accidents involving personal injury known to the police in Finland and reported to Statistics Finland, which have co-ordinate data. The data cover the following information: vvonn = year of the accident kkonn = month of the accident kello = time of the accident vakav = seriousness of the accident: 1 = accident resulting in death, 2 = accident resulting in injury, 3 = accident resulting in serious injury onntyyppi = type of accident: 0 = same direction of travel (going straight), 1 = same direction of travel (turning), 2 = opposite direction of travel (going straight), 3 = opposite direction of travel (turning), 4 = intersecting direction of travel (going straight), 5 = intersecting direction of travel (turning), 6 = pedestrian accident (on pedestrian crossing), 7 = pedestrian accident (elsewhere), 8 = running off the road, 9 = other accident lkmhapa = number of passenger cars and vans in the accident lkmlaka = number of buses and lorries in the accident lkmjk = number of pedestrians in the accident lkmpp = number of bicycles and light electric vehicles in the accident lkmmo = number of mopeds in the accident lkmmp = number of motor cycles in the accident lkmmuukulk = number of other vehicles in the accident x = x co-ordinate of the accident y = y co-ordinate of the accident The general Terms of Use must be observed when using the data: http://tilastokeskus.fi/org/lainsaadanto/copyright_en.html.
-
Materialet är sammanställt av Pargas stads gällande planer. Tilläggsinformation från Pargas stads mätningsbyrå. Uppdateras en gång i månaden.
-

Monimuotoisuudelle tärkeät metsäalueet 2018 (Zonation) -aineisto koostuu 12 koko metsäisen Suomen kattavasta Zonation-analyysien tuloskartasta (pois lukien Ahvenanmaa), jotka kuvaavat Suomen metsien monimuotoisuusarvoja. Aineiston VMA-alkuiset analyysit (6 kpl) kattavat koko Suomen ja AMA-alkuiset analyysit on tehty ELY-keskuksittain (6 kpl jokaiselle keskukselle). Versiot on rakennettu siten, että edellisessä versiossa käytetyt syöttöaineistot ovat mukana myös kaikissa seuraavissa versioissa. Mitä suurempi numeerinen arvo rasterissa on, sitä korkeampi on alueen prioriteetti metsien monimuotoisuuden näkökulmasta. Tulosten hilakoko on 96 x 96 metriä. Tulokset kattavat 15.5.2018 lähtien koko puustoisen Suomen (tämä poiketen raportissa kerrotusta ja aiemmin käytetystä rajauksesta, jossa aineistosta oli poistettu Metsähallitus Metsätalous Oy:n hallinnoimat alueet). Aineisto sisältää Syken latauspalvelun kautta aineiston ladanneille lisäksi .lyr-tiedoston, johon on määritetty valmiiksi värit ja analyysien kuvaukset aineistojen käyttöönoton sujuvoittamiseksi. Tämä auennee vain ESRIn paikkatieto- ohjelmilla. Aineisto kuuluu Syken avoimiin aineistoihin (CC BY 4.0) Lisätietoja: Tieteellinen julkaisu aineistosta (suositellaan käyttämään aineistoon viittauksen yhteydessä): Mikkonen, N., Leikola, N., Lehtomäki, J., Halme, P. & Moilanen, A. 2023. National high-resolution conservation prioritisation of boreal forests. Forest Ecology and Management 541(121079): 13. https://doi.org/10.1016/j.foreco.2023.121079 Suomenkielinen raportti analyyseistä ja niiden tuloksista: https://helda.helsinki.fi/handle/10138/234359 (Monimuotoisuudelle tärkeät metsäalueet Suomessa - Puustoisten elinympäristöjen monimuotoisuusarvojen Zonation-analyysien loppuraportti) Artikkeli analyysissä käytettyjen lahopuupotentiaalien mallintamisesta: https://doi.org/10.3390/f11090913 (Modeling of Dead Wood Potential Based on Tree Stand Data) Lyhyesti tulosaineitojen tuottaminen ja käyttö kolmella kielellä: URL: https://geoportal.ymparisto.fi/meta/julkinen/dokumentit/Zonation_metsa_forest_skog_Biodiversity_2018.pdf ********** Forests of high biodiversity value 2018 (Zonation) data-package consists of 12 nationwide raster maps from Finland (excluding Åland Islands). These are all different versions of biodiversity values of Finnish forests. Analyses are done in two scales: NAT = national scale (6 analysis) and REG = regional scale (6 analysis series), where region = Centre for Economic Development, Transport and the Environment. Different versions were built so that each new version included everything that had been included in previous, simpler, analysis versions. The bigger the numeric value in the raster is, the higher the biodiversity value is. Resolution of these raster maps is 96 meters x 96 meters. More information: Mikkonen, N., Leikola, N., Lehtomäki, J., Halme, P. & Moilanen, A. 2023. National high-resolution conservation prioritisation of boreal forests. Forest Ecology and Management 541(121079): 13. https://doi.org/10.1016/j.foreco.2023.121079 Article of how the dead wood potential was modeled for the analysis: Forests 2020, 11(9), 913; https://doi.org/10.3390/f11090913 General abstract about how the analyses were produced: URL: https://geoportal.ymparisto.fi/meta/julkinen/dokumentit/Zonation_metsa_forest_skog_Biodiversity_2018.pdf CC BY 4.0 ********** Datapaketet Skogsområden med högt biodiversitetsvärde i Finland 2018 (Zonation) består av 12 landsomfattande rasterkartor (utan Åland). Dessa 12 kartor är olika versioner av biodiversitetsvärden i Finlands skogar. Analyser är utarbetat I två måttstockar: national (sex analyser) och regional (sex analyser) (region = Närings-, trafik- och miljöcentralen i Finland). Olika prioriteringar gjordes så att varje ny version innefattade allt som fanns med i tidigare, enklare analysversioner. Ju större numeriskt värde I raster, desto högre biodiversitetsvärde. Rasterkartornas upplösning är 96 x 96 meter. Mera information: Mikkonen, N., Leikola, N., Lehtomäki, J., Halme, P. & Moilanen, A. 2023. National high-resolution conservation prioritisation of boreal forests. Forest Ecology and Management 541(121079): 13. https://doi.org/10.1016/j.foreco.2023.121079 URL: https://geoportal.ymparisto.fi/meta/julkinen/dokumentit/Zonation_metsa_forest_skog_Biodiversity_2018.pdf CC BY 4.0
-
Imatran kaupungin ylläpitämä sijaintitarkka kaavan pohjakartta-aineisto, maastoa, rakennettua ympäristöä ja kiinteistöjaotusta kuvaavia tietoja. Aineisto on tuotettu ilmakuvauksien, maastomittauksien ja kiinteistötoimitusten sekä rakennuslupakäsittelyn toimenpiteiden kautta. Päivitys ja ylläpito jatkuvaa. Aineisto sisältää kiinteistöt, rakennukset, liikenneväylät, nimistöt ja tunnisteet, vesistöt, korkeustiedot, maa- ja kasvipeitteen, runkopisteet sekä muut kohteet.
-
Yleisten alueiden rekisteri (Ylre) on Helsingin kaupungin kaupunkiympäristön toimialan järjestelmä, joka sisältää tietoja kaupungin katu- ja viheralueista. Aineistoa ylläpidetään kaupunkiympäristön toimialan käyttöön eikä se pääsääntöisesti kata muiden Helsingin kaupungin hallintokuntien tai laitosten vastuulla olevien yleisten alueiden omaisuuseriä. Yleisten alueiden rekisterin tietoja käytetään ylläpidon tilaamiseen Helsingin katu- ja puistoalueille. Rekisterin tietoja hyödynnetään mm. katu- ja puisto-osaston toiminnan raportoinnissa ja yleisten alueiden omaisuudenhallinnassa. Aineisto sisältää katu- ja viheralueiden kohteiden sijainnin ja luokittelun omaisuuseriin esimerkiksi käyttötarkoituksen tai toiminnallisuuden perusteella. Mukana on myös kohteiden materiaali- ja mallitietoja. Aineisto sisältää katu- ja viheralueiden ylläpito- ja hoitoluokat sekä kohteiden kunnossapidon ja talvihoidon vastuutahoja. Joistakin kohteista on tallennettu myös omistaja- ja vuokraustietoja. Ylre-aineistoa julkaistaan WFS-palveluna neljään eri karttatasoon jaettuna: katualueet, viheralueet, katualueen osat ja viheralueen osat. Katualueet ja viheralueet sisältävät laajoja, aluemaisia geometrioita. Aluejako pohjautuu pitkälti asemakaavamerkintöihin. Katu- ja viherosat tarkentavat katu- ja viheralueiden aluemaisten geometrioiden sisältöä. Katu- ja viherosat voivat olla aluemaisia, viivamaisia tai pistemäisiä geometrioita, jotka kiinnittyvät katualueiden ja viheralueiden päälle. Aluemaisia katu- tai puistoalueen osia voivat olla esim. ajorata, puistokäytävä tai istutusalue. Viivamaisia osia ovat esim. erilaiset aidat tai muurit. Pistemäisinä tallennetut osat ovat usein kalusteita tai varusteita, kuten penkkejä, leikkivälineitä tai jäteastioita. WFS-palvelun Ylre-aineisto päivittyy kerran vuorokaudessa yöaikaan, joten palvelun tarjoama data on edellisen päivän tilanne rekisteristä. Aineiston koordinaatisto on ETRS-GK25 (EPSG: 3879). Palvelun karttatasojen kentät on kuvailtu erillisessä dokumentissa täällä: http://www.hel.fi/static/hkr/wfs/WFS_ylre_kenttakuvaukset.pdf Aineisto julkaistaan WFS-palvelussa seuraavaa lisenssiä soveltaen: https://creativecommons.org/licenses/by/4.0/legalcode.fi Lähde: Helsingin kaupungin yleisten alueiden rekisteri. Aineiston ylläpitäjä on Helsingin kaupungin kaupunkiympäristön toimialan.
-
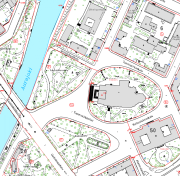
Yksityiskohtainen maastokartta eli kantakartta (1:500-1:2000) muodostaa pohja-aineiston rakentamiselle, kaavoitus- ja kiinteistömuodostustoiminnalle, kunnallisteknisille suunnitelmille, erilaisille yksityisille kartoille sekä opas- ja teemakartoille. Kantakartalla kuvattavia kohteita ovat kiinteistöt, rakennukset ja rakenteet, liikenneväylät, erilaiset maa- ja vesialueet, korkeustiedot, maanpäälliset johtotiedot, nimistö ja osoitteet. Aineisto on saatavissa myös WMS-palveluna.
 Paikkatietohakemisto