 Paikkatietohakemisto
environment
Type of resources
Available actions
Topics
Keywords
Contact for the resource
Provided by
Years
Formats
Representation types
Update frequencies
status
Scale
Resolution
-
FIN Aineiston tarkoituksena on: -Identifioida tie- ja rata-alueet, joiden varrella esiintyy uhanalaisia ja silmälläpidettäviä lajeja -Identifioida tie- ja rata-alueet, joiden varrella esiintyy hyviä elinvoimaisia niittyindikaattorilajeja (hyönteisten mesi- ja ravintokasveja) -Identifioida tie- ja rata-alueet, joiden varrella esiintyy suojelualueita -Identifioida tie- ja rata-alueet, joiden varrella esiintyy komealupiinia tai kurtturuusua -Identifioida tie- ja rata-alueet, joiden varrella esiintyy komealupiinia tai kurtturuusua uhanalaisten lajien lisäksi -> Löytää herkät alueet ja paikallistaa vieraslajien uhka Tieto esitetään 1 kilometrin ruuduissa. Aineistosta on julkaistu kaksi erillistä versiota. -VaylanvarsienVieraslajitJaArvokkaatElinymparistot_avoin: Avoin versio, jonka lajitietoa on karkeistettu mahdollisista herkistä lajeista johtuen. Aineisto kuuluu SYKEn avoimiin aineistoihin (CC BY 4.0) ja sitä saa käyttää lisenssiehtojen mukaisesti -VaylanvarsienVieraslajitJaArvokkaatElinymparistot_kayttorajoitettu: Alkuperäinen karkeistamaton versio. Tämä versio on vain viranomaiskäyttöön eikä kyseistä aineistoa saa jakaa Aineistosta on tehty tarkempi menetelmäkuvaus https://geoportal.ymparisto.fi/meta/julkinen/dokumentit/VierasVayla_Menetelmakuvaus.pdf sekä muuttujaseloste https://geoportal.ymparisto.fi/meta/julkinen/dokumentit/VierasVayla_VariableDescription.xlsx ENG The purpose of the material is to: -Identify road and rail areas that have nearby observations of endangered and near threatened species -Identify road and rail areas with good meadow indicator plant species -Identify road and rail areas along which there are protected areas -Identify the road and rail areas along which there are observations of Lupinus polyphyllus or Rosa rugosa observations -Identify the road and rail areas along which there are Lupinus polyphyllus or Rosa rugosa observations in addition to sensitive species -> Finds sensitive areas and identify the overall threat of alien species The data is presented in 1-kilometer square grid cells. There are two separate versions of the data. -VaylanvarsienVieraslajitJaArvokkaatElinymparistot_avoin: Open access version, in which its species-related parts have been simplified due to data restriction issues. The material belongs to Syke's open materials (CC BY 4.0) and may be used in accordance with the license terms. -VaylanvarsienVieraslajitJaArvokkaatElinymparistot_kayttorajoitettu: Original version. This version is only for official use and the material in question may not be shared. A more precise description about the data procedures can be found from (In Finnish) https://geoportal.ymparisto.fi/meta/julkinen/dokumentit/VierasVayla_Menetelmakuvaus.pdf Furthermore, all the variables in the data are explained in this bilingual variable description https://geoportal.ymparisto.fi/meta/julkinen/dokumentit/VierasVayla_VariableDescription.xlsx This dataset was updated with the newest species observations on 10/2023 and 11/2024 Process code for this can be found from https://github.com/PossibleSolutions/VierasVayla_SpeciesUpdate
-
FIN Suomen hiekkarantoja ja niiden taustatekijöitä kuvaava aineisto. Datan taustalla olevan hankkeen pääasiallisena tarkoituksena on hiekkarantojen identifioiminen parhaasta käytettävissä olevasta tiedosta, näiden rantojen ominaispiirteiden kuvaaminen, ympäristöllisen arvon arvioiminen sekä hoitotarpeessa olevien rantojen löytäminen. Aineistosta on julkaistu kaksi erillistä versiota. -HiekkarantojenOminaisuudet_avoin: Avoin versio, jonka lajitietoa on karkeistettu mahdollisista herkistä lajeista johtuen. Aineisto kuuluu SYKEn avoimiin aineistoihin (CC BY 4.0) ja sitä saa käyttää lisenssiehtojen mukaisesti -HiekkarantojenOminaisuudet_kayttorajoitettu: Alkuperäinen karkeistamaton versio. Tämä versio on vain viranomaiskäyttöön eikä kyseistä aineistoa saa jakaa” Aineistosta on tehty tarkempi menetelmäkuvaus https://geoportal.ymparisto.fi/meta/julkinen/dokumentit/RantaPutte_Menetelmakuvaus.pdf sekä muuttujaseloste https://geoportal.ymparisto.fi/meta/julkinen/dokumentit/RantaPutte_VariableDescription.xlsx ENG This data describes Finnish sandy beaches and their background factors. The main purpose of the project underlying the data is to identify sandy beaches from the best available information, to describe the characteristics of these beaches, to assess their environmental value and to find beaches in need of conservation There are two separate versions of the data. -HiekkarantojenOminaisuudet_avoin: Open access version, in which its species-related parts have been simplified due to data restriction issues. The material belongs to Syke's open materials (CC BY 4.0) and may be used in accordance with the license terms. -HiekkarantojenOminaisuudet_kayttorajoitettu: Original version. This version is only for official use and the material in question may not be shared. A more precise description about the data procedures can be found from (In Finnish) https://geoportal.ymparisto.fi/meta/julkinen/dokumentit/RantaPutte_Menetelmakuvaus.pdf All the variables in the data are explained in this bilingual variable description https://geoportal.ymparisto.fi/meta/julkinen/dokumentit/RantaPutte_VariableDescription.xlsx
-
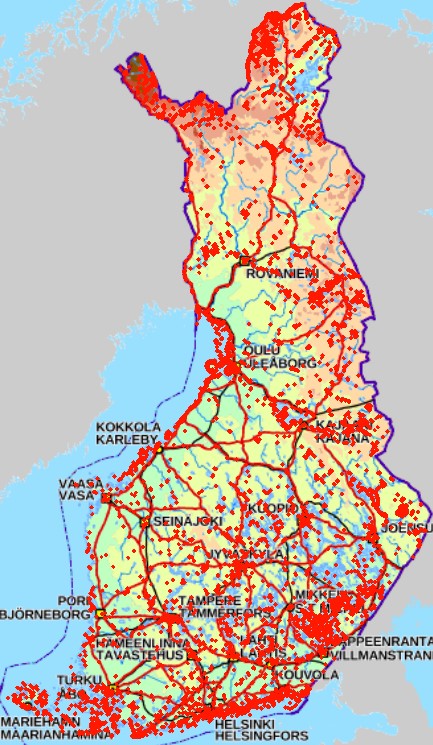
This dataset contains points of information describing the location and size of spills of mineral oil observed during aerial surveillance flights by HELCOM Contracting Parties during 1998-2023. The data covers detections from fixed-wing aircraft only. Since 2014 Contracting Parties have also reported spills of other substances and unknown substances. The purpose of the regional aerial surveillance is to detect spills of oil and other harmful substances and thus prevent violations of the existing regulations on prevention of pollution from ships. Such illegal spills are a form of pollution which threatens the marine environment of the Baltic Sea area. Further information on detected spills in the Baltic Sea area and HELCOM aerial surveillance activities can be found at http://www.helcom.fi/baltic-sea-trends/maritime/illegal-spills/ and https://helcom.fi/action-areas/response-to-spills/aerial-surveillance/ The dataset contains the following information: Country Year Spill_ID = A unique code which will enable each individual spill to be individually identified FlightType = The type of flight the detection was made during: National = "N", CEPCO = "C", Super CEPCO = "SC", Tour d’Horizon = “TDH” Date = The date of the detection (dd.mm.yyyy) Time_UTC = The time of the detection in UTC (hh:mm) Wind_speed = The wind speed at the time of the detection (m/s) Wind_direc = The wind direction in degrees at the time of the detection (degrees) Latitude = The latitude of the detection (decimal degrees, WGS84) Longitude = The longitude of the detection (decimal degrees, WGS84) Length__km = The length of the detection (km) Width__km = The width of the detection (km) Area__km2_ = The area of the detection (km2) Spill_cat = Spill/pollution category: Mineral Oil = “Oil", Other Substance = "Other substance" , "Unknown substance" = “Unknown” EstimVol_m = If Spill_cat="Oil", then estimated min. volume of oil spill. Volume of the detection confirmed/observed as mineral oil as calculated using the Bonn Agreement Oil Appearance Code using the lower figure (BAOAC minimum) in m3. Vol_Category = Category of the detection: <0,1m3 = “1”, <0,1-1m3 = “2”, 1-10 m3 = “3”, 10-100 m3 = “4”, >100 m3 = “5” Type_substance = If Spill_cat="Other substance" or "Unknown. Product name or type of OS or GAR substances that could be identified (in case of known polluter, or via visual identification - cf. BAOAC Atlas). - Examples for OS: vegetable oils (palm oil sun flower oil, soya oil etc.), fish oil, molasses, various chemicals (methanol, biodiesels/FAME, toluene, paraffines etc.); Examples of GAR: solid cargo residues (e.g. coal residues), plastics, fish nets, … OR "Unknown" (in case the type of substance could not be identified) Polluter = Type of polluter source: Offshore Installation = “Rig”, Vessel = “Ship”, Other Polluter or source (e.g. land based source) = “Other”, Unknown = “Unknwon” (in case of an “orphan” spill that cannot be linked to a polluter) Remarks = Any additional information to inform on particular situations Description of marine litter sightings
-
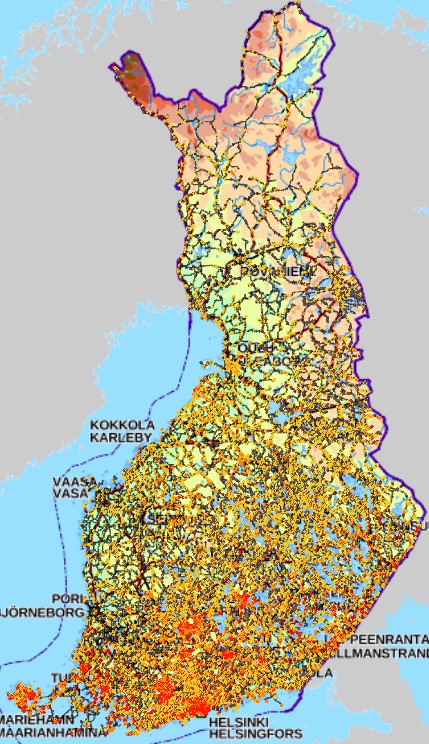
The Finnish Forest Research Institute (Metla) developed a method called multi-source national forest inventory (MS-NFI). The first operative results were calculated in 1990. Small area forest resource estimates, in here municipality level estimates, and estimates of variables in map form are calculated using field data from the Finnish national forest inventory, satellite images and other digital georeferenced data, such as topographic database of the National Land Survey of Finland. Six sets of estimates have been produced for the most part of the country until now and five sets for Lapland. The number of the map form themes in the most recent version, from year 2011, is 45. In addition to the volumes by tree species and timber assortments, the biomass by tree species groups and tree compartments have been estimated. The first country level estimates correspond to years 1990-1994. The most recent versions are from years 2005, 2007, 2009 and 2011. The maps from 2011 is the second set of products freely available. The new set of the products will be produced annually or biannually in the future. The maps are in a raster format with a pixel size of 20mx20m and in the ETRS-TM35FIN coordinate system. The products cover the combined land categories forest land, poorly productive forest land and unproductive land. The other land categories as well as water bodies have been delineated out using the elements of topographic database of the Land Survey of Finland.
-
The Finnish Forest Research Institute (Metla) developed a method called multi-source national forest inventory (MS-NFI). The first operative results were calculated in 1990. Small area forest resource estimates, in here municipality level estimates, and estimates of variables in map form are calculated using field data from the Finnish national forest inventory, satellite images and other digital georeferenced data, such as topographic database of the National Land Survey of Finland. Nine sets of estimates have been produced for the most part of the country until now and eight sets for Lapland. The number of the map form themes in the most recent version, from year 2017, is 45. In addition to the volumes by tree species and timber assortments, the biomass by tree species groups and tree compartments have been estimated. The first country level estimates correspond to years 1990-1994. The most recent versions are from years 2005, 2007, 2009, 2011, 2013, 2015 and 2017. The maps from 2017 is the fifth set of products freely available. It is also the third set produced by the Natural Resources Institute Finland. A new set of the products will be produced annually or biannually in the future. The maps are in a raster format with a pixel size of 16m x 16m (from 2013) and in the ETRS-TM35FIN coordinate system. The products cover the combined land categories forest land, poorly productive forest land and unproductive land. The other land categories as well as water bodies have been delineated out using the elements of the topographic database of the Land Survey of Finland.
-
The Baltic Sea Impact Index is an assessment component that describes the potential cumulative burden on the environment in different parts of the Baltic Sea. The BSII is based on georeferenced datasets of human activities (36 datasets), pressures (18 datasets) and ecosystem components (36 datasets), and on sensitivity estimates of ecosystem components (so-called sensitivity scores) that combine the pressure and ecosystem component layers, created in <a href="http://www.helcom.fi/helcom-at-work/projects/holas-ii" target="_blank">HOLAS II</a> project. Cumulative impacts are calculated for each assessment unit (1 km2 grid cells) by summing all pressures occurring in the unit for each ecosystem component. Highest impacts are found from the cells where both are abundant, but high impacts can be caused also by a single pressure if there are diverse and sensitive habitats in the grid cell. All data sets and methodologies used in the index calculations are approved by all HELCOM Contracting Parties in review and acceptance processes. This data set covers the time period 2011-2016. Please scroll down to "Lineage" and visit <a href="http://stateofthebalticsea.helcom.fi/cumulative-impacts/" target="_blank">State of the Baltic Sea website</a> for more info.
-
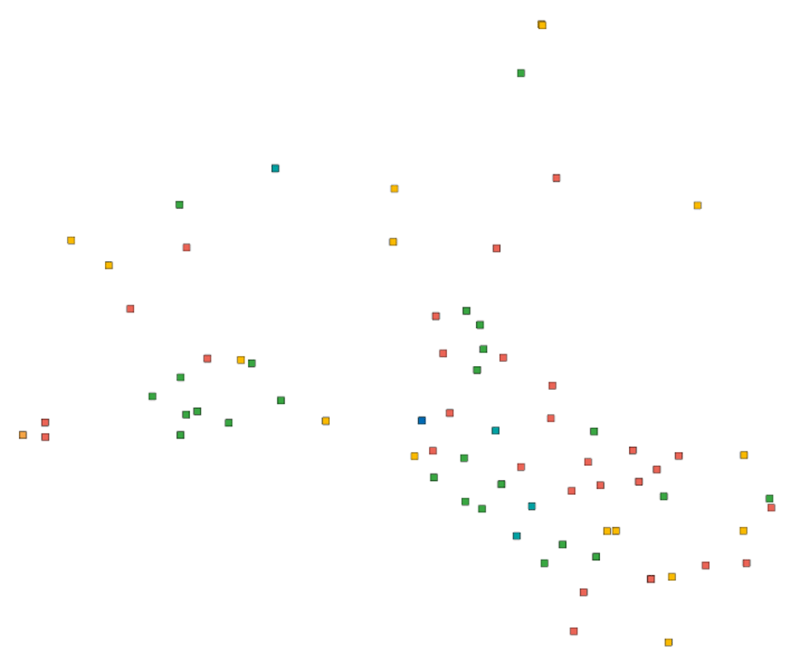
Production and Industrial Facilities contain the data set on establishments based on Statistics Finland's Business Register as follows: Data: location coordinates of the establishment, industry according to the Standard Industrial Classification TOL 2008 at the 2-digit level Industries according to D2.8.III.8 INSPIRE in TOL 2008 industries: B Mining and quarrying C Manufacturing D Electricity, gas steam and air conditioning supply E Water supply, sewerage, waste management and remediation activities F Construction H Transport and storage (excl. 53 Postal and courier activities) Coverage of the data set: establishments with over ten employees Statistical reference year: 2019 The data set is also suitable for viewing the location of industrial establishments. The coverage of the spatial data is about 90 % of the statistical data. The general Terms of Use must be observed when using the data: http://tilastokeskus.fi/org/lainsaadanto/copyright_en.html. In addition to the national version, an INSPIRE information product is also available from the data.
-
KUVAUS: Karttatason kohteet ovat peräisin Avoimet viheralueet Fiilis-karttakyselystä (viheralueet ja hulevedet yksikkö). KATTAVUUS: Tampere POIKKILEIKKAUS: Aineistoa ei ylläpidetä. KOORDINAATTIJÄRJESTELMÄ: Aineisto tallennetaan ETRS-GK24 (EPSG:3878) tasokoordinaattijärjestelmässä. GEOMETRIA: vektori (piste). SAATAVUUS: Aineisto on katsottavissa kirjautuneille käyttäjille Oskari-karttapalvelussa. AINEISTOSTA VASTAAVA TAHO: Tampereen kaupunki, Viheralueet ja hulevedet yksikkö
-
This dataset contains integrated eutrophication status assessment 2011-2016. The assessment is done using the HEAT 3.0 by combining assessment unit-specific results from various indicators by three MSFD criteria groups (C1: Nutrient levels, C2: Direct effect, C3: Indirect effect). The assessment is done on HELCOM Assessment Unit level 4: HELCOM Subbasins with coastal WFD water type or water bodies. The HEAT 3.0 has been applied for open sea assessment units using HELCOM core indicators and for coastal areas using national WFD indicators. In case of Denmark, the WFD results were used directly, displaying different classification as obtained from HEAT. For more information about the methodology, see the State of the Baltic Sea report and HELCOM Eutrophication assessment manual. Attribute information: "HELCOM_ID": ID of the HELCOM Level 4 Assessment unit "Country": Country/ Opensea "level_2": Name of the HELCOM Level 2 Assessment unit "Name": Name of the HELCOM Level 4 Assessment unit "Area_km2": Area of assessment unit "C1_N": MSFD criteria 1, number of indicators used for calculating Eutrophication Ratio (ER) "C1_ER": MSFD Criteria 1, ER "C1_SCORE": MSFD Criteria 1, Confidence of ER "C2_N": MSFD Criteria 2, number of indicators used for calculating ER "C2_ER": MSFD Criteria 2, ER "C2_SCORE": MSFD Criteria 2, Confidence of ER "C3_N": MSFD Criteria 3, number of indicators used for calculating ER "C3_ER": MSFD Criteria 3, ER "C3_SCORE": Criteria 3, Confidence of ER "N": Number of criteria used for calculating overall ER "ER": Overall ER "SCORE": Status confidence "STATUS": Status classification (Good (classes 0-0.5 & 0.5-1.0), Not Good (classes 1.0-1.5, 1.5-2.0 & >2.0), Not assessed) "CONFIDENCE": Final confidence class (< 50% = low, 50-74 % = Moderate, = 75 % = High) "AULEVEL": Level of assessment units
-
The Finnish Forest Research Institute (Metla) developed a method called multi-source national forest inventory (MS-NFI). The first operative results were calculated in 1990. The first country level estimates correspond to years 1990-1994. Small area forest resource estimates, in here municipality level estimates, and estimates of variables in map form are calculated using field data from the Finnish national forest inventory, satellite images and other digital georeferenced data, such as topographic database of the National Land Survey of Finland. Nine sets of estimates have been produced for the most part of the country until now and eight sets for Lapland. These three themes have been produced for production of the CORINE2006. The products cover the combined land categories forest land, poorly productive forest land and unproductive land. The other land categories as well as water bodies have been delineated out using the elements of the topographic database of the Land Survey of Finland. The original map data can be downloaded from http://kartta.luke.fi/