 Paikkatietohakemisto
environment
Type of resources
Available actions
Topics
Keywords
Contact for the resource
Provided by
Years
Formats
Representation types
Update frequencies
status
Scale
Resolution
-
FIN Aineiston tarkoituksena on: -Identifioida tie- ja rata-alueet, joiden varrella esiintyy uhanalaisia ja silmälläpidettäviä lajeja -Identifioida tie- ja rata-alueet, joiden varrella esiintyy hyviä elinvoimaisia niittyindikaattorilajeja (hyönteisten mesi- ja ravintokasveja) -Identifioida tie- ja rata-alueet, joiden varrella esiintyy suojelualueita -Identifioida tie- ja rata-alueet, joiden varrella esiintyy komealupiinia tai kurtturuusua -Identifioida tie- ja rata-alueet, joiden varrella esiintyy komealupiinia tai kurtturuusua uhanalaisten lajien lisäksi -> Löytää herkät alueet ja paikallistaa vieraslajien uhka Tieto esitetään 1 kilometrin ruuduissa. Aineistosta on julkaistu kaksi erillistä versiota. -VaylanvarsienVieraslajitJaArvokkaatElinymparistot_avoin: Avoin versio, jonka lajitietoa on karkeistettu mahdollisista herkistä lajeista johtuen. Aineisto kuuluu SYKEn avoimiin aineistoihin (CC BY 4.0) ja sitä saa käyttää lisenssiehtojen mukaisesti -VaylanvarsienVieraslajitJaArvokkaatElinymparistot_kayttorajoitettu: Alkuperäinen karkeistamaton versio. Tämä versio on vain viranomaiskäyttöön eikä kyseistä aineistoa saa jakaa Aineistosta on tehty tarkempi menetelmäkuvaus https://geoportal.ymparisto.fi/meta/julkinen/dokumentit/VierasVayla_Menetelmakuvaus.pdf sekä muuttujaseloste https://geoportal.ymparisto.fi/meta/julkinen/dokumentit/VierasVayla_VariableDescription.xlsx ENG The purpose of the material is to: -Identify road and rail areas that have nearby observations of endangered and near threatened species -Identify road and rail areas with good meadow indicator plant species -Identify road and rail areas along which there are protected areas -Identify the road and rail areas along which there are observations of Lupinus polyphyllus or Rosa rugosa observations -Identify the road and rail areas along which there are Lupinus polyphyllus or Rosa rugosa observations in addition to sensitive species -> Finds sensitive areas and identify the overall threat of alien species The data is presented in 1-kilometer square grid cells. There are two separate versions of the data. -VaylanvarsienVieraslajitJaArvokkaatElinymparistot_avoin: Open access version, in which its species-related parts have been simplified due to data restriction issues. The material belongs to Syke's open materials (CC BY 4.0) and may be used in accordance with the license terms. -VaylanvarsienVieraslajitJaArvokkaatElinymparistot_kayttorajoitettu: Original version. This version is only for official use and the material in question may not be shared. A more precise description about the data procedures can be found from (In Finnish) https://geoportal.ymparisto.fi/meta/julkinen/dokumentit/VierasVayla_Menetelmakuvaus.pdf Furthermore, all the variables in the data are explained in this bilingual variable description https://geoportal.ymparisto.fi/meta/julkinen/dokumentit/VierasVayla_VariableDescription.xlsx This dataset was updated with the newest species observations on 10/2023 and 11/2024 Process code for this can be found from https://github.com/PossibleSolutions/VierasVayla_SpeciesUpdate
-
KUVAUS: Karttataso sisältää sekajätteen keräysalueet, jotka tulevat voimaan kuudessa vaiheessa 31.12.2029 mennessä, sekä nykyisen voimassa olevan sekajätteen keräysalueen. PÄIVITYS: Satunnainen (vain tarvittaessa). YLLÄPITOSOVELLUS: Tampereen kaupungin tiedostopalvelin ja PostGIS-tietokanta KOORDINAATTIJÄRJESTELMÄ: Aineisto tallennetaan ETRS-GK24FIN (EPSG:3878) tasokoordinaattijärjestelmässä GEOMETRIA: vektori (alue) SAATAVUUS: Aineisto on tallennettu Postgis-tietokantaan. JULKISUUS: Aineisto on nähtävillä julkisesti kaikille käyttäjille Oskari-karttapalvelussa. TIETOSUOJA: Aineistoon ei liity tietosuojakysymyksiä. AINEISTOSTA VASTAAVA TAHO: Tampereen kaupunki, Alueellinen jätehuoltolautakunta, jatehuoltolautakunta@tampere.fi
-
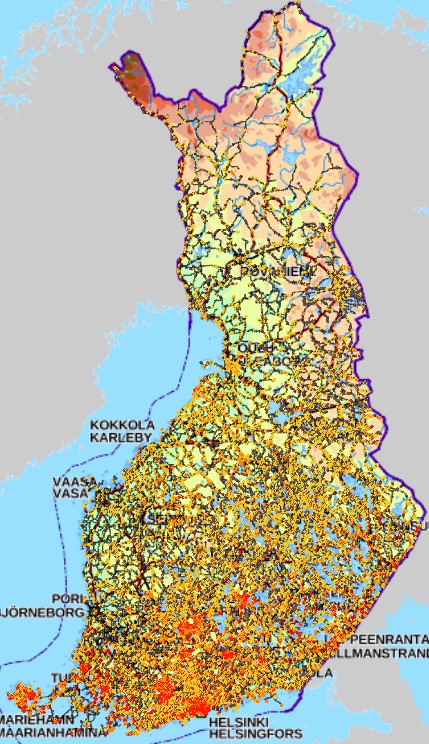
The Finnish Forest Research Institute (Metla) developed a method called multi-source national forest inventory (MS-NFI). The first operative results were calculated in 1990. Small area forest resource estimates, in here municipality level estimates, and estimates of variables in map form are calculated using field data from the Finnish national forest inventory, satellite images and other digital georeferenced data, such as topographic database of the National Land Survey of Finland. Seven sets of estimates have been produced for the most part of the country until now and six sets for Lapland. The number of the map form themes in the most recent version, from year 2015, is 45. In addition to the volumes by tree species and timber assortments, the biomass by tree species groups and tree compartments have been estimated. The first country level estimates correspond to years 1990-1994. The most recent versions are from years 2005, 2007, 2009, 2011, 2013 and 2015. The maps from 2015 is the fourth set of products freely available. It is also the second set produced by the Natural Resources Institute Finland. A new set of the products will be produced annually or biannually in the future. The maps are in a raster format with a pixel size of 16m x 16m (from 2013) and in the ETRS-TM35FIN coordinate system. The products cover the combined land categories forest land, poorly productive forest land and unproductive land. The other land categories as well as water bodies have been delineated out using the elements of the topographic database of the Land Survey of Finland.
-
This dataset represents the Integrated biodiversity status assessment for pelagic habitats using the BEAT tool. Status is shown in five categories based on the integrated assessment scores obtained in the tool. Biological Quality Ratios (BQR) above 0.6 correspond to good status. Open sea areas were assessed based on the core indicators ‘Zooplankton mean size and total stock’ and ‘Chlorophyll-a’, as well as the pre-core indicator ‘Cyanobacterial bloom index’ . Coastal areas were assessed by national indicators. This dataset displays the result of the integrated biodiversity status in HELCOM Assessment unit Scale 4 (Division of the Baltic Sea into 17 sub-basins and further division into coastal and off-shore areas and division of the coastal areas by WFD water types or water bodies). Attribute information: "BQR" = Biological Quality Ratio "Confidence" = Confidence of the assessment "HELCOM_ID" = Code of the HELCOM assessment unit "Country" = Country of coastal assessment unit/ open sea "Level2" = HELCOM sub-basins (name of the scale 2 assessment unit) "Name" = Name of the HELCOM scale 4 assessment unit "Area_km2" = Area of assessment unit "AULEVEL" = scale of the assessment unit "HID" = assessment unit ID by country "SAUID" = ID number for the spatial assessment unit "EcosystemC" = Ecosystem component assessed "Confiden_1" = Confidence of the assessment (0-1, higher values mean higher confidence) "Total_numb" = Number of indicators used in assessment "STATUS" = Integrated status category (0-0.2 = not good (lowest score), 0.2-0.4 = not good (lower score), 0.4-0.6 = not good (low score), 0.6-0.8 = good (high score, 0.8-1.0 = good (highest score))
-
The Finnish Forest Research Institute (Metla) developed a method called multi-source national forest inventory (MS-NFI). The first operative results were calculated in 1990. Small area forest resource estimates, in here municipality level estimates, and estimates of variables in map form are calculated using field data from the Finnish national forest inventory, satellite images and other digital georeferenced data, such as topographic database of the National Land Survey of Finland. Six sets of estimates have been produced for the most part of the country until now and five sets for Lapland. The number of the map form themes in the most recent version, from year 2011, is 45. In addition to the volumes by tree species and timber assortments, the biomass by tree species groups and tree compartments have been estimated. The first country level estimates correspond to years 1990-1994. The most recent versions are from years 2005, 2007, 2009 and 2011. The maps from 2011 is the second set of products freely available. The new set of the products will be produced annually or biannually in the future. The maps are in a raster format with a pixel size of 20mx20m and in the ETRS-TM35FIN coordinate system. The products cover the combined land categories forest land, poorly productive forest land and unproductive land. The other land categories as well as water bodies have been delineated out using the elements of topographic database of the Land Survey of Finland.
-
The Finnish Forest Research Institute (Metla) developed a method called multi-source national forest inventory (MS-NFI). The first operative results were calculated in 1990. Small area forest resource estimates, in here municipality level estimates, and estimates of variables in map form are calculated using field data from the Finnish national forest inventory, satellite images and other digital georeferenced data, such as topographic database of the National Land Survey of Finland. Five sets of estimates have been produced for the most part of the country until now and four sets for Lapland. The number of the map form themes in the most recent version, from year 2009, is 43. In addition to the volumes by tree species and timber assortments, the biomass by tree species groups and tree compartments have been estimated. The first country level estimates correspond to years 1990-1994. The most recent versions are from years 2005, 2007 and 2009. MS-NFI 2011 will be ready early 2013. The first set of the products freely available are from year 2009. The new set of the products will be produced annually or biannually in the future. The map from products are in a raster format with a pixel size of 20mx20m and in ETRS-TM35FIN coordinate system. The products cover the combined land categories forest land, poorly productive forest land and unproductive land. The other land categories as well as water bodies have been delineated out using the elements of topographic database of the Land Survey of Finland.
-
This dataset contains borders of the HELCOM MPAs (former Baltic Sea Protected Areas (BSPAs). The dataset has been compiled from data submitted by HELCOM Contracting Parties. It includes the borders of designated HELCOM MPAs stored in the http://mpas.helcom.fi. The designation is based on the HELCOM Recommendation 15/5 (1994). The dataset displays all designated or managed MPAs as officially reported to HELCOM by the respective Contracting Party. The latest related HELCOM publication based on MPA related data is http://www.helcom.fi/Lists/Publications/BSEP148.pdf The dataset contains the following information: MPA_ID: Unique ID of the MPA as used in HELCOM Marine Protected Areas database Name: Name of the MPA Country: Country where MPA is located Site_link: Direct link to site's fact sheet in the http://mpas.helcom.fi where additional information is available MPA_status: Management status of the MPA Date_est: Establishment date of the MPA Year_est: Establishment year of the MPA
-
This dataset contains the ship accidents in the Baltic Sea during the period 1989 to end of 2023. It is constructed from the annual data collected by HELCOM Contracting Parties on ship accidents in the Baltic Sea and starting from 2019 from EMSA EMCIP Database extraction (for those Contracting Parties that are member of the EU). The accident data has been compiled by the HELCOM Secretariat and EMSA. According to the decision of the HELCOM SEA 2/2001 shipping accident data compilation will include only so-called conventional ships according to the Regulation 5, Annex I of MARPOL 73/78 - any oil tanker of 150 GT and above and any other ships of 400 GT and above which are engaged in voyages to ports or offshore terminals under the jurisdiction of other Parties to the Convention. According to the agreed procedure all accidents (including but not limited to grounding, collision with other vessel or contact with fixed structures (offshore installations, wrecks, etc.), disabled vessel (e.g. machinery and/or structure failure), fire, explosions, etc.), which took place in territorial seas or EEZ of the Contracting Party irrespectively if there was pollution or not, are reported. The dataset contains the following information: Unique_ID = An unique identifier consisting of 4 digit running number and the year of the accident Country Year Date = Date (dd/mm/yyyy) Time = Time of the accident (hh:mm) Location = Location of the accident (open sea / port / port approach, from 2019 -> open sea / port) Acc_Type = Type of accident Colli_Type = Type of collision / contact (with vessel / object) Acc_Detail = More information on the accident CauseDetai = Details on the accident cause Assistance = Assistance after the accident Offence = Offence against Rule Damage = Damage to the ship HumanEleme = Occurrence / Reason of human error IceCondit = Ice conditions CrewIceTra = Crew trained for ice conditions Pollution = Pollution (Yes/No) Pollu_m3 = Pollution in m3 Pollu_t = Pollution in tonnes Pollu_Type = Type of pollution RespAction = Response actions after the accident Cargo_Type = Type of cargo Ship1_Name = Ship 1 identification (Not published after 2018) Sh1_Categ = Ship 1 type (according to AIS category) Sh1_Type = Ship 1 more detail ship type category Sh1_Hull = Ship 1 hull construction Sh1Size_gt = Ship 1 GT Sh1Sizedwt = Ship 1 DWT Sh1Draug_m = Ship 1 draught in meters / category Cause_Sh1 = Cause of accidents from ship 1 Pilot_Sh1 = Presence of pilot on ship 1 Ship2_Name = Ship 2 identification (Not published after 2018) Sh2_Categ = Ship 2 type (according to AIS category) Sh2_Type = Ship 2 more detail ship type category Sh2_Hull = Ship 2 hull construction Sh2Size_gt = Ship 2 GT Sh2Sizedwt = Ship 2 DWT Sh2Draug_m = Ship 2 draught in meters / category Cause_Sh2 = Cause of accidents from ship 2 Pilot_Sh2 = Presence of pilot on ship 2 Add_Info = Additional information Latitude = Latitude (decimal degrees) Longitude = Longitude (decimal degrees) For more information about shipping accidents in the Baltic Sea, see the HELCOM annual reports: https://helcom.fi/helcom-at-work/publications/ https://helcom.fi/media/publications/HELCOM-report-on-Shipping-accidents-in-the-Baltic-Sea-2019-211207-FINAL.pdf
-
The Baltic Sea Pressure Index is a calculation of quantity and spatial distribution of potential cumulative impacts on the Baltic Sea. The BSII is based on georeferenced datasets of human activities (36 datasets), pressures (18 datasets) and ecosystem components (36 datasets), and on sensitivity estimates of ecosystem components (so-called sensitivity scores) that combine the pressure and ecosystem component layers, created in <a href="http://www.helcom.fi/helcom-at-work/projects/holas-ii" target="_blank">HOLAS II</a> project. The assessment can be applied with a focus on pressures only by using the Baltic Sea Pressure Index (BSPI) which shows the anthropogenic pressures/human activities in the defined assessment units without including ecosystem components. The BSPI however includes a weighting component in order to grade the effect of the pressures on the ecosystem in a generalized perspective. Cumulative impacts are calculated for each assessment unit (1 km2 grid cells) by summing all impacts occurring in the unit. All datasets and methodologies used in the index calculations are approved by all HELCOM Contracting Parties in review and acceptance processes. This dataset covers the time period 2011-2016. Please scroll down to "Lineage" and visit <a href="http://stateofthebalticsea.helcom.fi/cumulative-impacts/" target="_blank">State of the Baltic Sea website</a> for more info.
-
The Finnish Forest Research Institute (Metla) developed a method called multi-source national forest inventory (MS-NFI). The first operative results were calculated in 1990. The first country level estimates correspond to years 1990-1994. Small area forest resource estimates, in here municipality level estimates, and estimates of variables in map form are calculated using field data from the Finnish national forest inventory, satellite images and other digital georeferenced data, such as topographic database of the National Land Survey of Finland. Nine sets of estimates have been produced for the most part of the country until now and eight sets for Lapland. These three themes have been produced for production of the CORINE2006. The products cover the combined land categories forest land, poorly productive forest land and unproductive land. The other land categories as well as water bodies have been delineated out using the elements of the topographic database of the Land Survey of Finland. The original map data can be downloaded from http://kartta.luke.fi/